No buyer guide found.
Best Data Visualization Software
If your business analysts sigh at the thought of spreadsheets then, data visualization software is your ultimate solution. The software reports raw data and converts it into aesthetic graphs, charts, pivot tables, and other forms of visual presentations that help to have a clear overview of complex information. In-place filtering features enable the users to look up tons of figures by value, category, or type through dropdowns, checkboxes, radio buttons, and more, saving valuable time. Data discovery tools facilitate the swift detection of sequences, patterns, and outliners in data sets that can be effortlessly analyzed without having to design several models. The convenient embeddability of the software into other operational systems allows the business to collaborate efficiently and easily share valuable reports across required platforms. The friendly user-interface allows anytime-anywhere access to the data. Moreover, role-based access to the software ensures advanced security and prioritization of tasks. Relying on spreadsheets alone can be fatal to your company’s competitive advantage. Here is a list of Data Visualization Software that will help to unlock the value of your collected data.
- 4.6 avg. rating from 03 reviews
Last Updated: October 01, 2025
All Software
-
Comparison
764 Software
Top 10 Data Visualization Software
List of Best Data Visualization Software
Pricing Options
Monthly Subscription
Annual Subscription
One-Time Payment
Quote Based
Features
Company Size
Self Employed
Small Business
Medium Business
Enterprise
HRCast is a powerful HR analytics software designed to help human resources teams make data-driven decisions that improve employee performance, engagement, and retention. The platform integrates with existing HR systems to collect and analyze data across various areas, including recruitment, performance management, compensation, and employee satisfaction. HRCast’s advanced analytics tools enable... Read more about HRCast
DataMyth is an innovative reporting software designed to help organizations create, manage, and analyze reports efficiently. The platform provides comprehensive tools for data visualization, enabling users to generate insightful reports that facilitate data-driven decision-making. DataMyth allows users to connect to various data sources, ensuring that they can aggregate and visualize data from mul... Read more about DataMyth
BStreams is a powerful data visualization software designed to help businesses transform complex datasets into clear, actionable insights. With BStreams, users can create interactive dashboards, charts, and graphs that present data in a visually engaging and easy-to-understand format. The software supports a wide range of data sources, allowing businesses to integrate information from various syst... Read more about BStreams
Sontai is an intuitive dashboard software that provides businesses with real-time insights into their operations, performance, and key metrics. The platform enables users to create customizable dashboards that aggregate data from various sources, allowing decision-makers to visualize trends, monitor KPIs, and make data-driven decisions. With Sontai, businesses can pull information from sales, mark... Read more about Sontai
BAG-Tower is an incident management software designed to help organizations manage and resolve incidents efficiently, minimizing disruption to business operations. With BAG-Tower, users can report incidents, assign resolution tasks, and monitor progress through a centralized dashboard. The software’s customizable workflows allow companies to tailor incident handling to meet their specific needs.... Read more about BAG-Tower
OnTop is a comprehensive manufacturing execution software (MES) that helps manufacturers optimize production processes, manage workflows, and track performance in realtime. Designed to support the entire manufacturing lifecycle, OnTop enables production managers to monitor and control operations from scheduling and inventory management to quality assurance. The software provides realtime data on m... Read more about OnTop
Plod is an advanced data visualization software that empowers organizations to transform complex data into actionable insights. This platform provides tools for creating interactive dashboards, reports, and visualizations that help users understand trends and patterns in their data. With a user-friendly interface, Plod allows users to easily connect to various data sources, manipulate data, and cu... Read more about Plod
Mitra is a comprehensive project management software designed to help organizations plan, execute, and monitor projects efficiently. This platform provides users with tools for task management, resource allocation, and team collaboration, ensuring that projects are completed on time and within budget. With Mitra, project managers can create detailed project plans, assign tasks to team members, and... Read more about Mitra
Piwoot is a dynamic reporting software designed to simplify the creation, management, and analysis of business reports. It offers a comprehensive suite of tools including data visualization, automated report generation, customizable dashboards, and real-time analytics, ensuring that organizations have access to accurate and actionable insights. Piwoot's intuitive interface allows users to easily c... Read more about Piwoot
Indy Analytics is a heatmap software that provides businesses with in-depth visual insights into user behavior across websites and digital platforms. By using advanced data analytics and visualization techniques, it helps businesses understand where users click, scroll, and spend time, allowing them to optimize their websites for better user experience and higher conversions. Indy Analytics genera... Read more about Indy Analytics
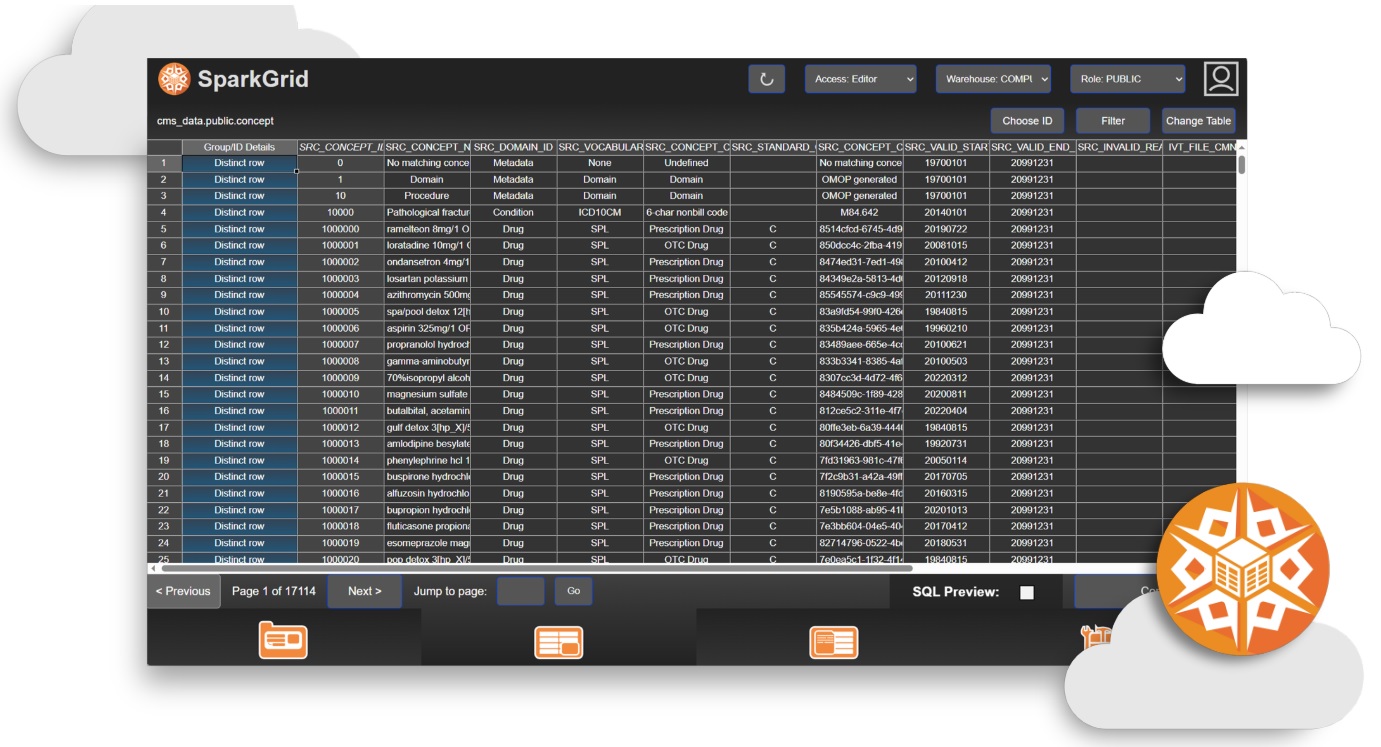
SparkGrid serves as data visualization software by presenting complex database information in a clean, spreadsheet-style layout that highlights patterns and relationships at a glance. Users can sort, filter, and edit data interactively—making it easier to identify trends, outliers, and actionable insights. It simplifies visualization by turning raw data into structured clarity. Read more about SparkGrid
BlinkMetrics is a powerful business intelligence (BI) software designed to help organizations turn raw data into actionable insights. This platform empowers businesses to make data-driven decisions by providing tools for data visualization, reporting, and advanced analytics. With BlinkMetrics, businesses can gather data from a variety of sources, including CRM systems, marketing platforms, and fin... Read more about BlinkMetrics
CoBOS is an advanced data management software that allows organizations to store, organize, and retrieve vast amounts of information efficiently. Designed with flexibility and scalability in mind, CoBOS supports various data types, including structured, semi-structured, and unstructured data. With its powerful indexing and search capabilities, users can quickly access the information they need wit... Read more about CoBOS
Indellia is a robust customer experience (CX) software designed to help businesses enhance every touchpoint of the customer journey. Whether you're interacting with customers through email, live chat, social media, or in-person, Indellia provides a centralized platform for managing customer relationships and improving satisfaction. The software includes advanced tools for collecting and analyzing ... Read more about Indellia
Ventivo is an advanced data visualization software that helps businesses transform raw data into interactive, insightful visual representations. With its intuitive interface and powerful visualization tools, Ventivo makes it easy for users to create detailed reports, dashboards, and charts that are both aesthetically appealing and informative. The software supports a wide range of data sources, al... Read more about Ventivo
Vidusi is a data visualization software designed to transform complex data sets into interactive and visually engaging charts, graphs, and dashboards. With Vidusi, businesses can create customizable visual reports that make it easier to understand trends, identify key insights, and communicate findings to stakeholders. The software supports a wide range of data sources, allowing users to import da... Read more about Vidusi
Revenyze is an advanced data visualization software designed to help organizations transform complex data sets into actionable insights through engaging visual representations. This platform provides users with a suite of tools for creating interactive dashboards, charts, and graphs that make data analysis intuitive and accessible. With Revenyze, businesses can connect to various data sources, ena... Read more about Revenyze
Analytics4now is a sophisticated data visualization software platform designed to help businesses make sense of complex data and transform it into actionable insights. The platform enables users to create stunning, interactive visualizations that make it easier to understand trends, patterns, and correlations within large datasets. Analytics4now supports a wide range of data sources and integrates... Read more about Analytics4now
Everyday Analytics is a data visualization software designed to help businesses turn complex data into clear, actionable insights. This platform enables users to create interactive reports, dashboards, and visualizations that make it easy to understand key metrics and trends. Everyday Analytics integrates with a wide range of data sources, from spreadsheets to databases, allowing users to pull and... Read more about Everyday Analytics
Deckpilot is an innovative data visualization software designed to help businesses turn complex data into clear, actionable insights. It enables users to create visually engaging and interactive dashboards, charts, and reports, allowing teams to easily interpret and present data. Deckpilot’s intuitive interface allows both technical and non-technical users to design custom visualizations that me... Read more about Deckpilot
PROvis is a sophisticated data visualization software designed to help businesses turn complex data into actionable insights through visually compelling and easy-to-understand charts, graphs, and dashboards. The platform allows users to connect to a wide range of data sources, including databases, spreadsheets, and cloud services, and transform raw data into visually engaging reports. PROvis inclu... Read more about PROvis
DataLynx is a cutting-edge data visualization software designed to transform complex data sets into clear, interactive, and visually appealing graphics. The platform offers a wide range of visualization tools, including charts, graphs, maps, and dashboards, enabling users to present data in a meaningful and easily understandable format. DataLynx's intuitive interface allows users to create customi... Read more about DataLynx
Datoris is a powerful data analysis software designed to assist organizations in making data-driven decisions. This platform offers tools for collecting, analyzing, and visualizing data from various sources, enabling users to uncover insights into performance and trends. Datoris includes features for creating customizable dashboards, generating reports, and conducting advanced analytics, making it... Read more about Datoris
Report Hopper is a dynamic reporting software solution designed to help businesses generate, manage, and distribute custom reports. The software offers a range of tools for creating professional reports from a variety of data sources, including databases, spreadsheets, and cloud applications. With Report Hopper, users can design custom templates, set up automated report generation, and schedule re... Read more about Report Hopper
Industrytics is an artificial intelligence (AI) software platform that helps businesses harness the power of data-driven insights to optimize operations and make informed decisions. Equipped with machine learning, predictive analytics, and automation tools, Industrytics enables users to uncover patterns in data, forecast trends, and streamline workflows. Its user-friendly interface allows companie... Read more about Industrytics
